2022 APMCM summary sheet
Because of the terrible power of nuclear weapons, many countries hope to use it to deter other countries and protect themselves from foreign invasion. Based on nuclear weapons development data of various countries over the years, this paper analyzes and predicts the change trend of nuclear weapons in the future, and establishes the lethality model to calculate the destructive capability of nuclear weapons. The following analysis is carried out for each problem.
For the first problem, firstly, the data is preprocessed, and the obtained data is drawn into line charts and bar charts for descriptive analysis and visual analysis. Then, the entropy weight method is used to calculate the weights of the variables of status, tests and stockpile, which are 0.0422,0.9198 and 0.0380, respectively. The country that is most active in nuclear weapons research is calculated according to the weights obtained.
For the second problem, first of all, the number of nuclear weapons in the whole country is obtained through data processing. Then, the relationship between the storage number and the year is found by fitting. After repeated adjustment, the coefficient of determination of each fitting result is no less than 0.8, and the relationship between the year and the number of nuclear weapons of each country and the whole world is obtained. The fitting model is established to predict the number of nuclear weapons. In order to increase the accuracy of the prediction results, the ARIMA(p, d, q) prediction model is established to predict the number of nuclear weapons in the future and the countries that may possess nuclear weapons in the future. Due to the international situation, it is understood that South Africa has voluntarily given up the development of nuclear weapons, so the forecast data does not include South Africa.
For the third problem, the lethal model of the detonation location of nuclear weapons is first established, which is described from two aspects: the killing power of blast wave and the degree of nuclear radiation damage. The effective killing distance and area are calculated according to the nuclear bomb killing formula, and the blast shock wave overpressure peak value is calculated by using the empirical formula of spherical charge explosion in infinite air medium. The killing radius corresponding to different impact damage levels is obtained and the explosion wave power model is established. The degree of nuclear radiation damage mainly depends on the sum of neutron and γ radiation dose absorbed by human body. Then, the model is used to calculate the damage range of “Big Ivan” nuclear bomb with 100 megabytes of THT equivalent and the number of destroyed earth. It can be seen that the number of existing nuclear bombs cannot destroy the earth. Finally, taking 10% of land damage as the limit of total nuclear warheads, the number of nuclear warheads destroyed by a large country is taken as the maximum number of nuclear warheads possessed by a nuclear country.
Key words: entropy weight method, fitting, time series model
Contents
[TOC]
1 Problem background and restatement
1.1 Problem background
Nuclear weapon refers to the huge deadly weapons related to nuclear reaction, including hydrogen bomb, atomic bomb, neutron bomb, etc. It is one of the most powerful weapons developed by human beings and has a terrible power. Therefore, many countries hope to use it to deter other countries and protect their own countries from foreign invasion. After World War II, all countries in the world began to frantically develop and manufacture atomic bombs, “Big Ivan” is now the world’s known most powerful nuclear bomb. Many people believe that nuclear weapons can destroy the Earth many times over by affecting the living conditions of human beings on Earth.
1.2 Problem restatement
Based on the above background, and on the basis of collecting data on nuclear weapons development, research and development attitudes and policies of various countries over the past years, the following questions are answered.
- A mathematical model is established and the relevant data are used for quantitative analysis to identify the countries that possess nuclear weapons, the countries that have reduced or increased their stockpiles the most in the past 20 years, the five years in which nuclear weapons tests have occurred the most, the countries that have been the most active in nuclear weapons research in the past decade, and the countries that have made the fastest transition from “no consideration of nuclear weapons” to “possession of nuclear weapons”.
- To build a mathematical model to predict the number of nuclear weapons, predict the next 100 years of nuclear weapon states and the number of nuclear weapons, the total number of nuclear weapons in 2123, the number of nuclear weapons in each country to change trends.
- To build a mathematical model of the detonation location of nuclear weapons and calculate the maximum destructive power of nuclear weapons. Estimate the minimum number of nuclear bombsthat could destroy the planet, and determine whether the current total number of nuclear bombs could destroy the planet. To protect the planet and the environment on which we live, set limits on the total number of nuclear bombs in the world and the number of nuclear bombs by nuclear states.
2 Problem analysis
2.1 Problem one analysis
According to the four tables of data on nuclear weapons of each country given in the annex of the title, the change of each country’s position on nuclear weapons is analyzed. By studying the stockpiles of nuclear warheads of each country in the past 78 years and comparing the changes of nuclear warhead stockpiles of 10countries, the bar chart of the world’s annual nuclear weapons tests in the past 78 years is drawn. And draw a broken line chart showing the changing positions of countries that once possessed nuclear weapons on nuclear weapons.The attachment data is preprocessed, the data in the form is analyzed by entropy weight method,and the status of each country, the number of tests, and the weight of stockpile changes are calculated.
2.2 Problem two analysis
The nuclear weapon reserves of the countries in the annex have been indicated in each year, so it is necessary to predict the number of nuclear weapons in the future. The establishment of a prediction model to calculate the number of nuclear weapons in a future year according to the existing historical data belongsto the prediction problem. Due to the large number of countries, it is particularly important to extract the relationship between the number of nuclear weapons in each country and the year. Since the storage capacity changes with time, the time series model is chosen here to predict the future storage capacity.
2.3 Problem three analysis
In view of problem 3, firstly, the establishment of the lethal model of the detonation location: firstly, we can directly establish the explosive wave power model from the power of nuclear explosion itself, considering the effective killing range (area)generated by the shock wave, the heat energy released and the peak overpressure of the explosion wave; Secondly, the killing power of nuclear weapons can be described indirectly from the damage degree of nuclear radiation to human body and environment. In a nuclear explosion, a large number of neutrons and γ radiation are released, and the damage of nuclear radiation to human body mainly depends on the sum of the neutrons and γ radiation absorbed.
Then, as for the choice of the TNT equivalent of nuclear bomb, considering the large energy needed to destroy the earth, we chose “Big Ivan”, the largest TNT equivalent of 100M.Finally, in terms of the limitation of nuclear warheads, according to the data, it is impossible to achieve zero nuclear warheads, so we can only choose to reduce the damage of nuclear explosions to the earth and reduce the total number of nuclear warheads, and we choose 10% of the land destruction area. For nuclear states, the role of nuclear bombs in safeguarding national security should be considered. Therefore, the number of nuclear warheads destroyed by a large country is taken as the maximum number of nuclear warheads possessed by a nuclear state.
3 Problem hypothesis
- Assume that all nuclear bombs in the world have a TNT equivalent of 100Mt.
- Assume that the detonation of a nuclear bomb is instantaneous, disregarding the nuclear reaction process of the explosion.
- Assume that the energy from a nuclear bomb explosion is all expressed in the form of a shock wave and travels in a straight line.
- Assume that the kill power of multiple nuclear bombs is equal to the sum of TNT equivalent.
- Assume that the nuclear explosion is a ground nuclear explosion, and the damage to the ground explosion is close to a circle.
- Assume that the air density is standard air density 1.29kg/m.
4 Symbol description
In order to facilitate reading and understanding, the paper gives a unified explanation of important variables, as shown in Tab. 4-1.
5 Model and solution of problem one
5.1 a preprocessing
For problem 1, first of all, check the data in the attachment, and use matlab programming to check the following data anomalies:
- Whether there is a missing value;
- Import the data into matlab to check for the presence of NaNso, to determine whether there are outliers.
- Use the unique function to check and weed out a large number of duplicate values. After calculation, there are no missing values, outliers, duplicate values in the attachment.
5.2 Descriptive statistical analysis
Question a requires to analyze the position form in the attachment of the topic, and summarize the data according to Status, 0 is none, l is Consideration, 2 is Pursuit, 3 is Possession, and the conclusion can be reached: Russia, the United States, China, France, the United Kingdom, Pakistan, India, Israel, North Korea and South Africa once possessed nuclear weapons.
According to question b, analyze the form in the attachment to obtain Tab.5-1.Nuclear weapons change line Fig.5-1 is obtained by using matlab to draw according to data in form Stockpiles. According to Tab.5-1 and Fig.5-1, it can be concluded that in the past 20 years, nuclear weapons stockpile of United States has changed the most. The stockpile has decreased by 6749.
To solve question d, we use the entropy weight method to analyze the weight of variations, using status in the form Tests and stockpile in the form Position the. The principle is as follows:
- Standardize the data, so that the data is distributed between 0 and l. There is a formula below.
where,
𝜇_𝑗 = \frac{1}{n}\sum \limits _{i = 1}^n 𝑎_{𝑖𝑗}
𝑠_𝑗 = \sqrt {\frac{1}{n-1} \sum \limits _{i = 1}^n {(a_{𝑖𝑗}− 𝜇_𝑗)^2}}
-
Calculate the information entropy of each index according to the definition of information entropy in information theory, the information entropy of a group of data is below.
where,
-
Finally determine the weight of each index.
The entropy weight method obtains its Status, the number of Tests, and the Stockpile variation with the weight of 0.0422,0.9198, 0.0380. Calculate it by weight PRK is the most active, and conclude that in the past decade, Russia has been the most active in nuclear weapons research.
6 Model and solution of problem two
6.1 Data preprocessing
For problem 2, we first conduct pre-processing and check for attachment data Stockpile: whether there are missing values, duplicate values, outlier values, etc. In order to reduce the error, we set the data years from 1945 to 2022 as 1 to 78.And calculate the comparison table of the world’s years and nuclear weapons reserves, as shown in Tab.6-1.
No missing data or abnormal data has been found after examination for Stockpile. The data Stockpile of each country is relatively complete with a wide range of years and high reliability of data.
6.2 Problem 2 Model establishment
The data is the reserves of nuclear weapons, and the data dimension is relatively low. The year and reserves comparison table of each country can be fitted with the data.The principle of linear fitting is as follows.
-
The least square method is used to find the fitting equation of the number of annual nuclear weapons in each country and the world.
After the fitting equation is obtained, the goodness of fit of the equation is obtained by using the formula to judge the fitting effect. When the goodness of fit is close to 1, the fitting effect is better.
𝑆𝑆𝑇 = \sum \limits _{i = 1}^n (𝑦_𝑖 − 𝑦̅) ^2
𝑆𝑆𝑅 = \sum \limits _{i = 1}^n(𝑦̂_i − 𝑦̅ ) ^2
For question a, we establish a time series model and solve the model.
Step 1: Data stationarity test
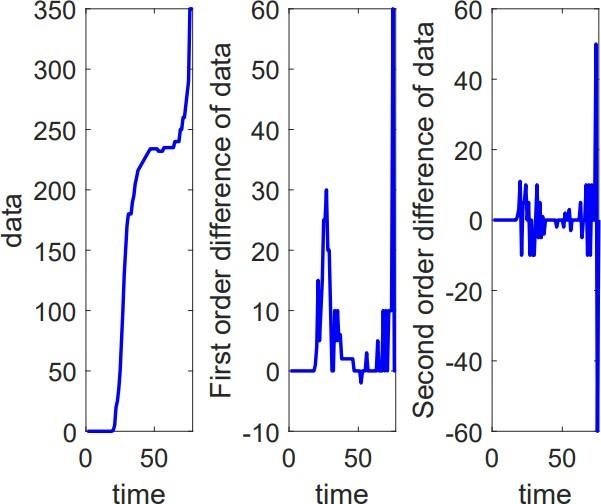
Firstly, using Matlab to test the data stationarity. If the data of different countries are found to be less stable after being brought in, the difference of the original data is taken, and then the test is carried out until it passes the test. Because there are many countries, we takes China as an example here, as shown in Fig.6-1.
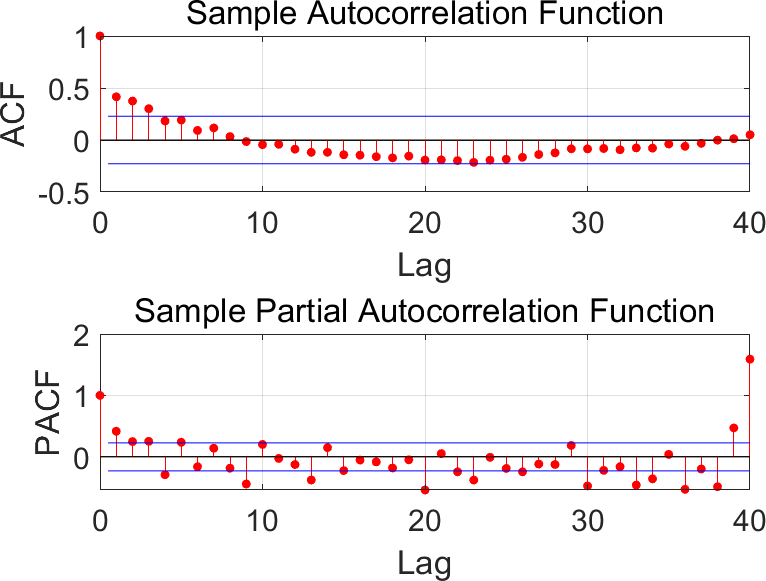
The model parameters p, q and d were determined by autocorrelation function(ACF) and partial autocorrelation function(PACF) based on the stabilized data. Where d isthe difference order, p, q are determined by the order of the following equation using AIC and BIC criteria through matlab.
X_𝒕 = 𝒄 + a_𝟏 X_{𝒕−𝟏} + 𝜶_𝟐 X_{𝒕−𝟐} + ⋯ + 𝜶_𝒑 X_{𝒕−𝒑} + 𝜺_𝒕 + 𝜷_𝟏 𝜺_{𝒕−𝟏} + ⋯ + 𝜷_𝒒 𝜺_{𝒕−𝒒}
The autocorrelation and partial autocorrelation graphs drawn by matlab are shown in Fig.6-2.
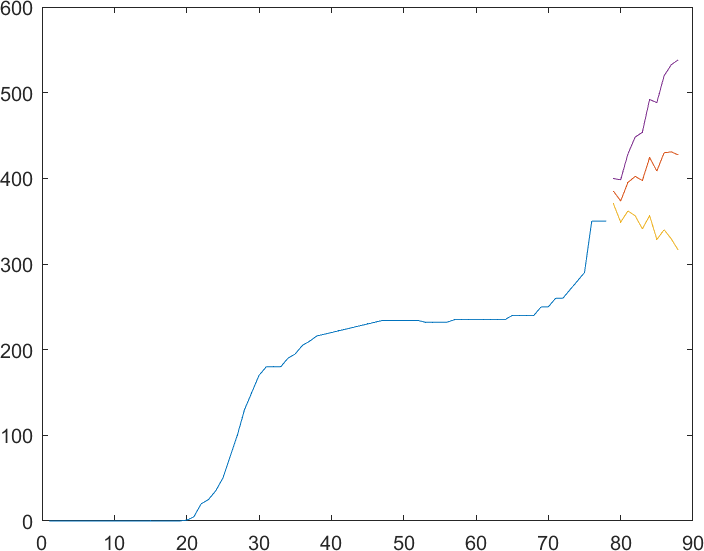
Matlab and its own prediction tool are used to construct and predict the model and Fig. 6-3 is obtained:
Step 1: For question b, the relationship between the number and year of nuclear weapons in the country and the world can be obtained by using fitting calculation, as shown in Fig.6-4 to Fig.6-10.
The formula for World is:
By substituting the number corresponding to the year 2123 into each formula, we can get the number of nuclear weapons in China, France, India, Israel, North Korea, Pakistan, Russia, United Kingdom and United States: 58183, 577920, 876, 242, 23938, 918, 4.23864e+006, 21074, 947211.
Through linear fitting, the number of nuclear weapons of each country and the world in the next 100 years can be preliminarily predicted. In order to further reduce the error and improve the accuracy, the time series model is used to solve the model.
For question a, ARIMA(p, d, q) model is selected. p, d and q parameters are determined, and d-order backward difference is calculated.
The arima formula calculated.
((1 − \sum \limits _{i = 1}^p ∅_𝑖 𝐵^𝑖)(1 − 𝐵)^𝑑 𝑌_𝑖 = (1 + \sum \limits _{i = 1}^q 𝜃_𝑖 𝐵^𝑖) 𝜀_𝑖 ↔ (1 − 𝐵)^𝑑 𝑌_𝑖 − \sum \limits _{i = 1}^p ∅𝑖(1 − 𝐵)^𝑑 Y^{𝑡−𝑖} = \sum \limits _{i = 1}^q 𝜃_𝑖 𝜀_{𝑖−1} +𝜀_𝑖)
Build the model, use the time prediction model tool in spsspro to get the prediction results, and make the test set more than 90% correct. Finally, the following results are obtained by importing the data.
| Country | North Korea | United Kingdom | United States | World |
|---|---|---|---|---|
| Stockpile | 45.9 | 1128 | 1691 | 59788 |
| R² | 0.857 | 0.958 | 0.992 | 0.979 |
Step 2: Analyze and process the attached data position, and use the time series prediction model to solve the nuclear weapon states in 100 years. Due to the large amount of data, the data of ten countries that already know the situation of nuclear weapons are first removed, and then the status of all countries from 1938 to 2022 are removed, and the 19 countries that are most likely to possess nuclear weapons in the next 100 years are obtained. Then, the time series model is used to predict the status development of each country in 100 years, and the Tab.6-3 is shown as follows:
We can see that Iran is most likely to have nuclear weapons 100 years from now, so the countries that have nuclear weapons 100 years from now are Iran, Russia, the United States, China, France, the United Kingdom, Pakistan, India, Israel, North Korea.
7 Model and solution of problem three
7.1 Solution and analysis of Question
7.1.1 of nuclear weapon Lethality
By establishing the lethality model of the detonating position of nuclear weapons, we can describe it by the killing power of its explosion shock wave and the damage degree of nuclear radiation to human body and environment. The blast wave is a factor to be considered when the missile and the target are detonated in close contact. A model of blast wave power is established to describe the killing power of blast wave. According to the nuclear bomb lethal formula, we can effectively describe the effective killing distance R and area S of nuclear bomb explosion.
𝑆 = 𝜋 × 𝑅^2
Where, C is the constant of proportionality, taking the value of 1.493885, and Q is THT equivalent.
The calculation of the peak overpressure of the explosion shock wave can be done by using the empirical formula of spherical charge explosion in infinite air medium.
𝛥𝑃_{𝑚𝑎𝑥} = \frac {0.082} {𝑍} + \frac {0.26} {𝑍^2} + \frac {0.69 } {𝑍^3 }
Where, ΔP is the explosion shock wave overpressure peak (MPa),Z is the contrast distance (m/kg ),R is the radius of spherical expansion, and Q is the equivalent of TNT.
According to Tab.7-1, the damage grade caused by shock wave can be judged, and the killing radius corresponding to different impact injury grades can be calculated. Mild impact damage radius range [399.04,522.35)𝑄(m), moderate impact damage radius range [264.04,399.04)𝑄(m), severe impact damage radius range [201.91,264.04)𝑄(m), and extremely severe impact damage radius range(0,201.91)𝑄(m).[2]
During a nuclear explosion, a large number of neutrons and γ radiation are released .And the extent to which nuclear radiation harms the human body depends mainly on the sum of the neutrons and γ radiation doses absorbed by the human body[1].The formula for calculatingneutron dose in nuclear radiation is
𝐷_{𝑜𝑛} = 4.9 × 10^7 𝑄 \frac {𝑒^{\frac {−𝑟𝜌} {230}}} {𝑟^2}
𝜌 = 1.226 × {[1 − 2.22 × 10^−5 (𝑍 +\frac{𝐻} {𝑍} )]}^{4256}
Where, D~𝑜𝑛~is the neutron dose (Gy), Q is the TNTequivalent (kt),r is the distance from the ground point to the detonation center (m), and ρ is the air density at the half of detonation height (mg/cm3 ),Z is the elevation of the projection point of the detonation center (m), and H is the explosion height (m).
When is the far zone (rρ > 2000m ∙ mg/cm^3^), the formula for calculating γ radiation dose of nuclear radiation is
𝐷_{𝑜𝑟} = 9.1 × 10 ^{−3} 𝐾(𝑄) \frac {𝑒 \frac{−𝑟𝜌} {415}} {𝑟^2}
When it is near region (rρ<2000m ∙ mg/cm^3^ ), the formula for calculating γ radiation dose of nuclear radiation is
𝐷_{𝑜𝑟} = 2.24 × 10 ^{−2} 𝐾(𝑄) \frac {𝑒 \frac{−𝑟𝜌} {340}} {𝑟^2}
Where,r is the distance from the ground point to the detonation center(m), and ρ is the air density at the half of detonation height (mg/cm3 ),the calculation is the same as formula 7-4, Q is the nuclear detonation equivalent(kt),coefficient K(Q) = 2.82 × 10^8^× (2 + Q)^1.3^.
Therefore, the absorbed dose of nuclear radiation is 𝐷~𝑛𝑟~= 𝐷~𝑜𝑛~ +𝐷~𝑜𝑟~.According to 𝐷~𝑛𝑟~, the acute radiation degress grade is obtained.This is shown in Tab.7-2.
The radiation hazard to the environment can be estimated by the degree of damage to animals and plants. The maximum radiation dose of human body can only be 100mSv (mSv = mGy × K, K is the variable coefficient, value is 0.5), and the radiation dose of the smallest TNT equivalent nuclear bomb known in the world is beyond the tolerable range of human beings and unfit for human habitation. lf the natural recovery time after the missile explosion exceeds the earth’s 5 billion years of life, it can also be considered destroyed.
7.1.2 um number of nuclear bombs to destroy the Earth
The Earth was originally gravitationally collapsed from the remnants of the solar nebula, and to shatter the Earth into a nebula that can no longer be gravitationally held together, the energy produced by the nuclear bomb would need to exceed the gravitational binding energy of the Earth, which the energy required 2.2 × 1032 J. Because 1tTNT = 4.19 × 10⁹ J, so 2.2 × 1032 J is the equivalent of 5.25 × 10²² tTNT, and the number of nuclear bombs in 100 megabytes TNT equivalent is 5.25 × 10^14^.
The number of nuclear bombs in 100-megabyte TNT equivalent needed to blast off the surface of the world is 23.57 × 1012.lf destroying the earth is to make the earth uninhabitable, that is to destroy the living environment of human beings and creatures on the earth. The five conditions for life on Earth are stable sunlight, a safe orbit, suitable temperature, liquid water, and the thickness and composition of the atmosphere. Destroying the atmosphere need 3.2 × 1026J and heating the Earth’s oceans to evaporate and drying out all the land need 7.0 × 1027J . So the number of nuclear bombs in 100-megabyte TNT equivalent is 1.74 × 10¹⁰.
7.2 Solution and analysis of b question
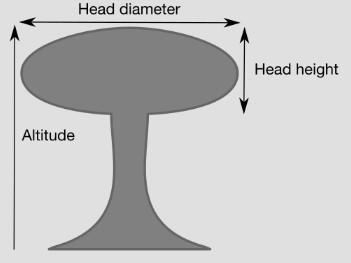
“Big Ivan” is the most powerful nuclear bomb known in the world at present, namely the Czar Bomb made in the Soviet era. It is 8m in length, 2.1m in diameter, can weigh up to 27t and has a design TNT equivalent of 100Mt. According to the formula 16 and formula 17, the maximum effective kill radius is 25.55km, resulting in an effective kill area of 2055.05𝑘𝑚^2^, and the energy of 2.10 × 10¹³ J released by the shock wave. According to the simulation of nuclear explosion, the altitude of the mushroom cloud is 52.8km, the diameter of the mushroom cloud head is 204km, and the height of the mushroom cloud head is 11.4km.
At 20 psi overpressure, heavy concrete structures were severely damaged or dismantled, with fatalities approaching 100%.The medium blast damage radius (5 psi) is 21.2 km and the area is 1,420 km².At 5 psi overpressure, most residential buildings collapse with widespread injury and death. The potential for fire in commercial and residential damage is high, and damaged buildings are likely to spread fire. The light burst damage radius (1 psi) is 54.6 km and the area is 9,370 km².At an overpressure of about 1 psi, the glass window may break. The thermal radiation radius(Third degree burns) is 64.2 km and the area is 12,960km².Third degree burns burn all skin and because of the destruction of painful nerves, are usually painless, which can lead to severe scarring or disability, and may require amputation.
7.3. Solution and Analysis of c Question
Since the end of the Cold War, steps have been taken to reduce nuclear arsenals and some progress has been made, but the world’s total stockpile of nuclear warheads remains at a very high level. Today, there are 12,705 nuclear warheads in possession by nine countries.Fig.7-3 shows that 86% of nuclear warheads are owned by Russia and the United States, which have a combined stockpile of 8,185. The number of nuclear warheads needed to protect national security is exaggerated. As Fig.7-4 shows, the total global stockpile of nuclear weapons is declining, but at a slower rate than over the past 30 years. Among them, the United States and Russia are slowly reducing their stockpiles. France’s and Israel’s stockpiles are relatively stable. But China, India, North Korea, Pakistan are adding to their stockpiles. The current nuclear states do not seem to be planning nuclear disarmament, but rather to keep large arsenals indefinitely; All are committed to modernizing their remaining nuclear forces, and all seem committed to retaining nuclear weapons indefinitely, in conflict with the Nuclear Non-Proliferation Treaty. In the short term, it is highly unlikely that the world will achieve a total stockpile of zero nuclear weapons and protect the planet from nuclear destruction.
8 Model and solution of problem four
8.1 discovery
-
Regarding the basic data analysis, we conclude based on the analysis.
- Russia, the United States, China, France, the United Kingdom, Pakistan, India, Israel, North Korea, South Africa and other countries used to have nuclear weapons.
- The United States has the biggest change in its stockpile, with its stockpile dropping by 6,749.
- The largest number of nuclear weapons tests occurred in 1962, 1958, 1968, 1966, 1966 and 1965, with 178, 116, 79, 76 and 71.
- Russia has been the most active in nuclear weapons research over the past decade.
- The United States has made the fastest transition from “not considering nuclear weapons” to “possessing nuclear weapons.”
-
Predict the number of nuclear weapons
- In 100 years, the country that might have nuclear weapons is Iran.
- China, France, India, Israel, North Korea, Pakistan, Russia, the United Kingdom, the United States and the World. Each have 58, 183, 577, 920, 876, 242, 23938, 618, 4.23864e+006, 21074, 947211, 1.53598e+007 nuclear weapons.
-
Protect our planet
- Destroying the planet requires at least 1.74 × 10¹⁰ nuclear bomb.
- Currently nuclear bombs have a maximum effective kill radius of 25.55km, resulting in an effective kill area of 2055.05km2 and the energy released 2.10 × 10¹³ J by the shock wave; Not enough to destroy the Earth, but it can destroy 18% of the land area.
- To protect our planet, the total global stockpile limit is 7,250 nuclear warheads, and the nuclear power limit is 487.
8.2 Recommendations
The Earth is our home, and so far, the only planet suitable for human habitation. But nuclear weapons will cause damage to the biological environment of the earth, and the environment destroyed by nuclear weapons is no longer suitable for human habitation. Therefore, here is my advice to the States possessing nuclear weapons: All nuclear- weapon States should refrain from being the first to use nuclear weapons at any time and under any circumstances, and refrain from using or threatening to use nuclear weapons against non-nuclear-weapon States or nuclear-weapon-free zones.
9 Sensitivity analysis of the model
According to the analysis of the problem, it is known that status will have a great influence on which countries possess nuclear weapons in the next 100 years. In order to test the sensitivity of the model, direct derivation sensitivity analysis is selected for Algeria’s status data.
Use y to represent the status forecast after 100 years, and x to represent the status data from 1938 to 2022, representing the initial value data y0. And the following relationship is satisfied.
Differential equation of sensitivity can be obtained with respect to differentiation X~j~ .
\frac d {dt} \frac {𝜕y} {𝜕x_j}=j \frac {𝜕y} {𝜕x_j} + \frac {𝜕f} {𝜕x_j} (S=JṠ+F)
The sensitivity formula can be obtained by 𝑆 taking the derivative of pair x~j~ .
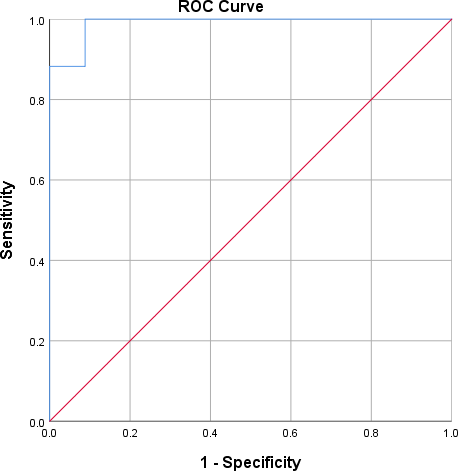
SPSS was used to make the roc curve of Syria, and the sensitivity graph was as follows.
10.1 advantages of the model
-
The entropy weight method can ensure that the index weight is not subject to subjective influence, so that the results can be carried out according to the calculated weight and the results are more objective.
-
The time series model makes full use of the original data, the calculation speed is fast, the precision is high, and the prediction of the future data is more accurate.
10.2 advantages of the model
This paper only predicts the future development of nuclear weapons in the world and in each country based on the annual attitudes towards nuclear weapons of all countries from 1938 to now, the annual average stockpile of nuclear weapons of all countries, and the total number of nuclear-weapon states in the world each year. There may be limitations in the data of characteristic attributes, which can appropriately increase the world and other influential factors affecting nuclear weapons research.
10.3 l Improvement
All in all, the models established in this paper are consistent with the actual situation and have certain guidance. At the same time, the models can be analyzed at a deeper level. The models have high classification accuracy and good generalization performance, and can be applied to the study of the impact of explosive weapons on the environment, the impact of volcanic eruption on the environment and other fields.
Reference
[1] Yang Zhehai. Model Study on the Effect of Terrain on the firing of Indirect Artillery and the killing efficiency of nuclear Weapons [D]. PLA Information Engineering University, 2001.
[2] Zou Shiya, Zhang Wenzhong, Mao Yongze. Mathematical model of battlefield target damage effect of neutron bomb explosion [J]. Nuclear Electronics and Detection Technology, 2006(02): 132-136.
[3] LIU Tong. Research on Kill Power Evaluation Method of Air Defense Warhead [D]. Nanjing University of Science and Technology, 2004.Team E apmcm2206077
Attachment
Attachment 1
Question 2 raw data(Comparison table of years and nuclearweapons reservesin the world)
Attachment 2
code 1: Time prediction model
subplot(131)
plot(data,'b-','LineWidth',2)
xlabel('time')
ylabel('data')
set(gca,'fontsize',15)
subplot(132)
data1 = diff(data);
plot(data1,'b-','LineWidth',2)
xlabel('time')
ylabel('First-order differential of data')
set(gca,'fontsize',15)
subplot(133)
data2 = diff(data,2);
plot(data2,'b-','LineWidth',2)
xlabel('time')%Set the label
ylabel('Second-order difference of data')
set(gca,'fontsize',15)
adftest(data)%Test the data
kpsstest(data)
data1 = diff(data);
d1_adf = adftest(data1)
d1_kpss = kpsstest(data1)
figure
subplot(211)
autocorr(ddata,40)
ylabel('ACF')
set(gca,'fontsize',15)
subplot(212)
parcorr(ddata,40)
ylabel('PACF')
set(gca,'fontsize',15)
pm = 4;
qm = 4;
d = 1;
%[p q ]=findPQ(data,pm,qm,d);%Find the functions of p and q
p = 3;q = 4;% Model start construction
Mdl = arima(p, 1, q);
EstMdl = estimate(Mdl,data');
step = 10;
[forData,YMSE] = forecast(EstMdl,step,'Y0',data');
l = forData - 1.96*sqrt(YMSE);Team E apmcm2206077
Page 23 of 24
u = forData + 1.96*sqrt(YMSE); %Here is the confidence interval of 95
figure
plot(1:length(data),data)
hold on
plot((length(data)+1):length(data)+step,forData)
hold on
plot((length(data)+1):length(data)+step,l)
plot((length(data)+1):length(data)+step,u)
code 2: Line chart of changesin the magnitude of nuclear weaponsstockpiles
x=1:1:21;
%xData on the axis, the first value represents the start of the data, the second value represents the interval, and the third value represents the termination
a=[235,235,235,235,235,235,235,240,240,240,240,250,250,260,260,270,280,290,350,350,350]; %a data y value  CHN
b=[350,350,350,350,350,350,300,300,300,300,300,300,300,300,300,300,300,300,290,290,290]; %b data y value  FRA
c=[23,28,33,38,43,50,60,70,80,90,100,110,100,110,120,130,140,140,150,160,160];%IND
d=[76,78,80,80,80,80,80,80,80,80,80,80,80,80,80,80,80,80,90,90,90];%ISR
e=[0,0,0,0,0,0,0,0,0,0,0,0,0,5,10,15,20,25,35,20,20];%PRK
f=[26,32,38,44,50,60,70,80,90,100,110,115,120,125,130,140,150,150,160,165,165];%PAK
g=[10114,9076,8038,7000,6643,6286,5929,5527,5215,4858,4750,4650,4600,4500,4490,4300,4350,4330,4310,4495,4477];%RUS
h=[0,0,0,0,0,0,0,0,0,0,0,0,0,0,0,0,0,0,0,0,0];%ZAF
i=[280,280,280,280,225,225,225,225,225,225,225,225,220,215,215,215,210,205,195,180,180];
%GBR
j=[10457,10027,8570,8360,7853,5709,5273,5113,5066,4897,4881,4804,4717,4571,4018,3822,3785,3805,3750,3708,3708];%USA
plot(x,a,'r',x,b,'g',x,c,'b',x,d,'c',x,e,'m',x,f,'y',x,g,'r',x,h,'g',x,i,'b',x,j,'c'); %Linear, color, marker
axis([0,21,0,700]) %Determine the x-axis and y-axis block plot size
set(gca,'XTick',[2:22:1]) %xAxis range 2002-2022, interval 5
set(gca,'YTick',[0:2000:12000]) %yShaft range 0-12000 with 2000 intervals
legend('CHN','FRA','IND','ISR','PRK','PAK','RUS','ZAF','GBR','USA'); %Callout in the upper right corner
xlabel('Year') %xDescription of axis coordinates
ylabel('Changes in nuclear weapons stocks') %yDescription of axis coordinates
title("Nuclear weapons change line graph")
code 3:Entropy weight law
[n1,m1]=size(a);
for j=1:m1
	C(:,j)=(a(:,j)-min(a(:,j)))./(max(a(:,j))-min(a(:,j)));
	%CConstitute a matrix
end

for i=1:n1
	for j=1:m1
		P(i,j)=C(i,j)./sum(C(:,j));
       end
end

for i=1:n1
	for j=1:m1
		if P(i,j)==0
			P(i,j)=1E-6
		end
	end
end
for j=1:m1
	e(j)=(-1/log(n1))*sum(P(:,j).*log(P(:,j)));%ultiply
end
d=1-e
for j=1:m1
	wn(j)=d(j)/sum(d)
end
s=wn*P';s=s';
[ssort,id]=sort(s,'descend')%Get the result